


How to Monitor macOS Hosts With Osquery
Modern operating systems hold a wealth of data about their operation. This data is spread across APIs, files and formats, rendering it difficult to find and track the important information. Security teams are finding that the proliferation of encryption is pushing their operations towards endpoints as indicators of compromise disappear from their networks. IT teams need to track compliance and health of the hosts they manage. Hobbyists would just like to have convenient access to information. With these increasing information needs, host instrumentation systems are proliferating across the industry.
While Windows has a mature market for host instrumentation products, the options on macOS have been severely limited. Professionals and hobbyists alike now have a solid open-source option.
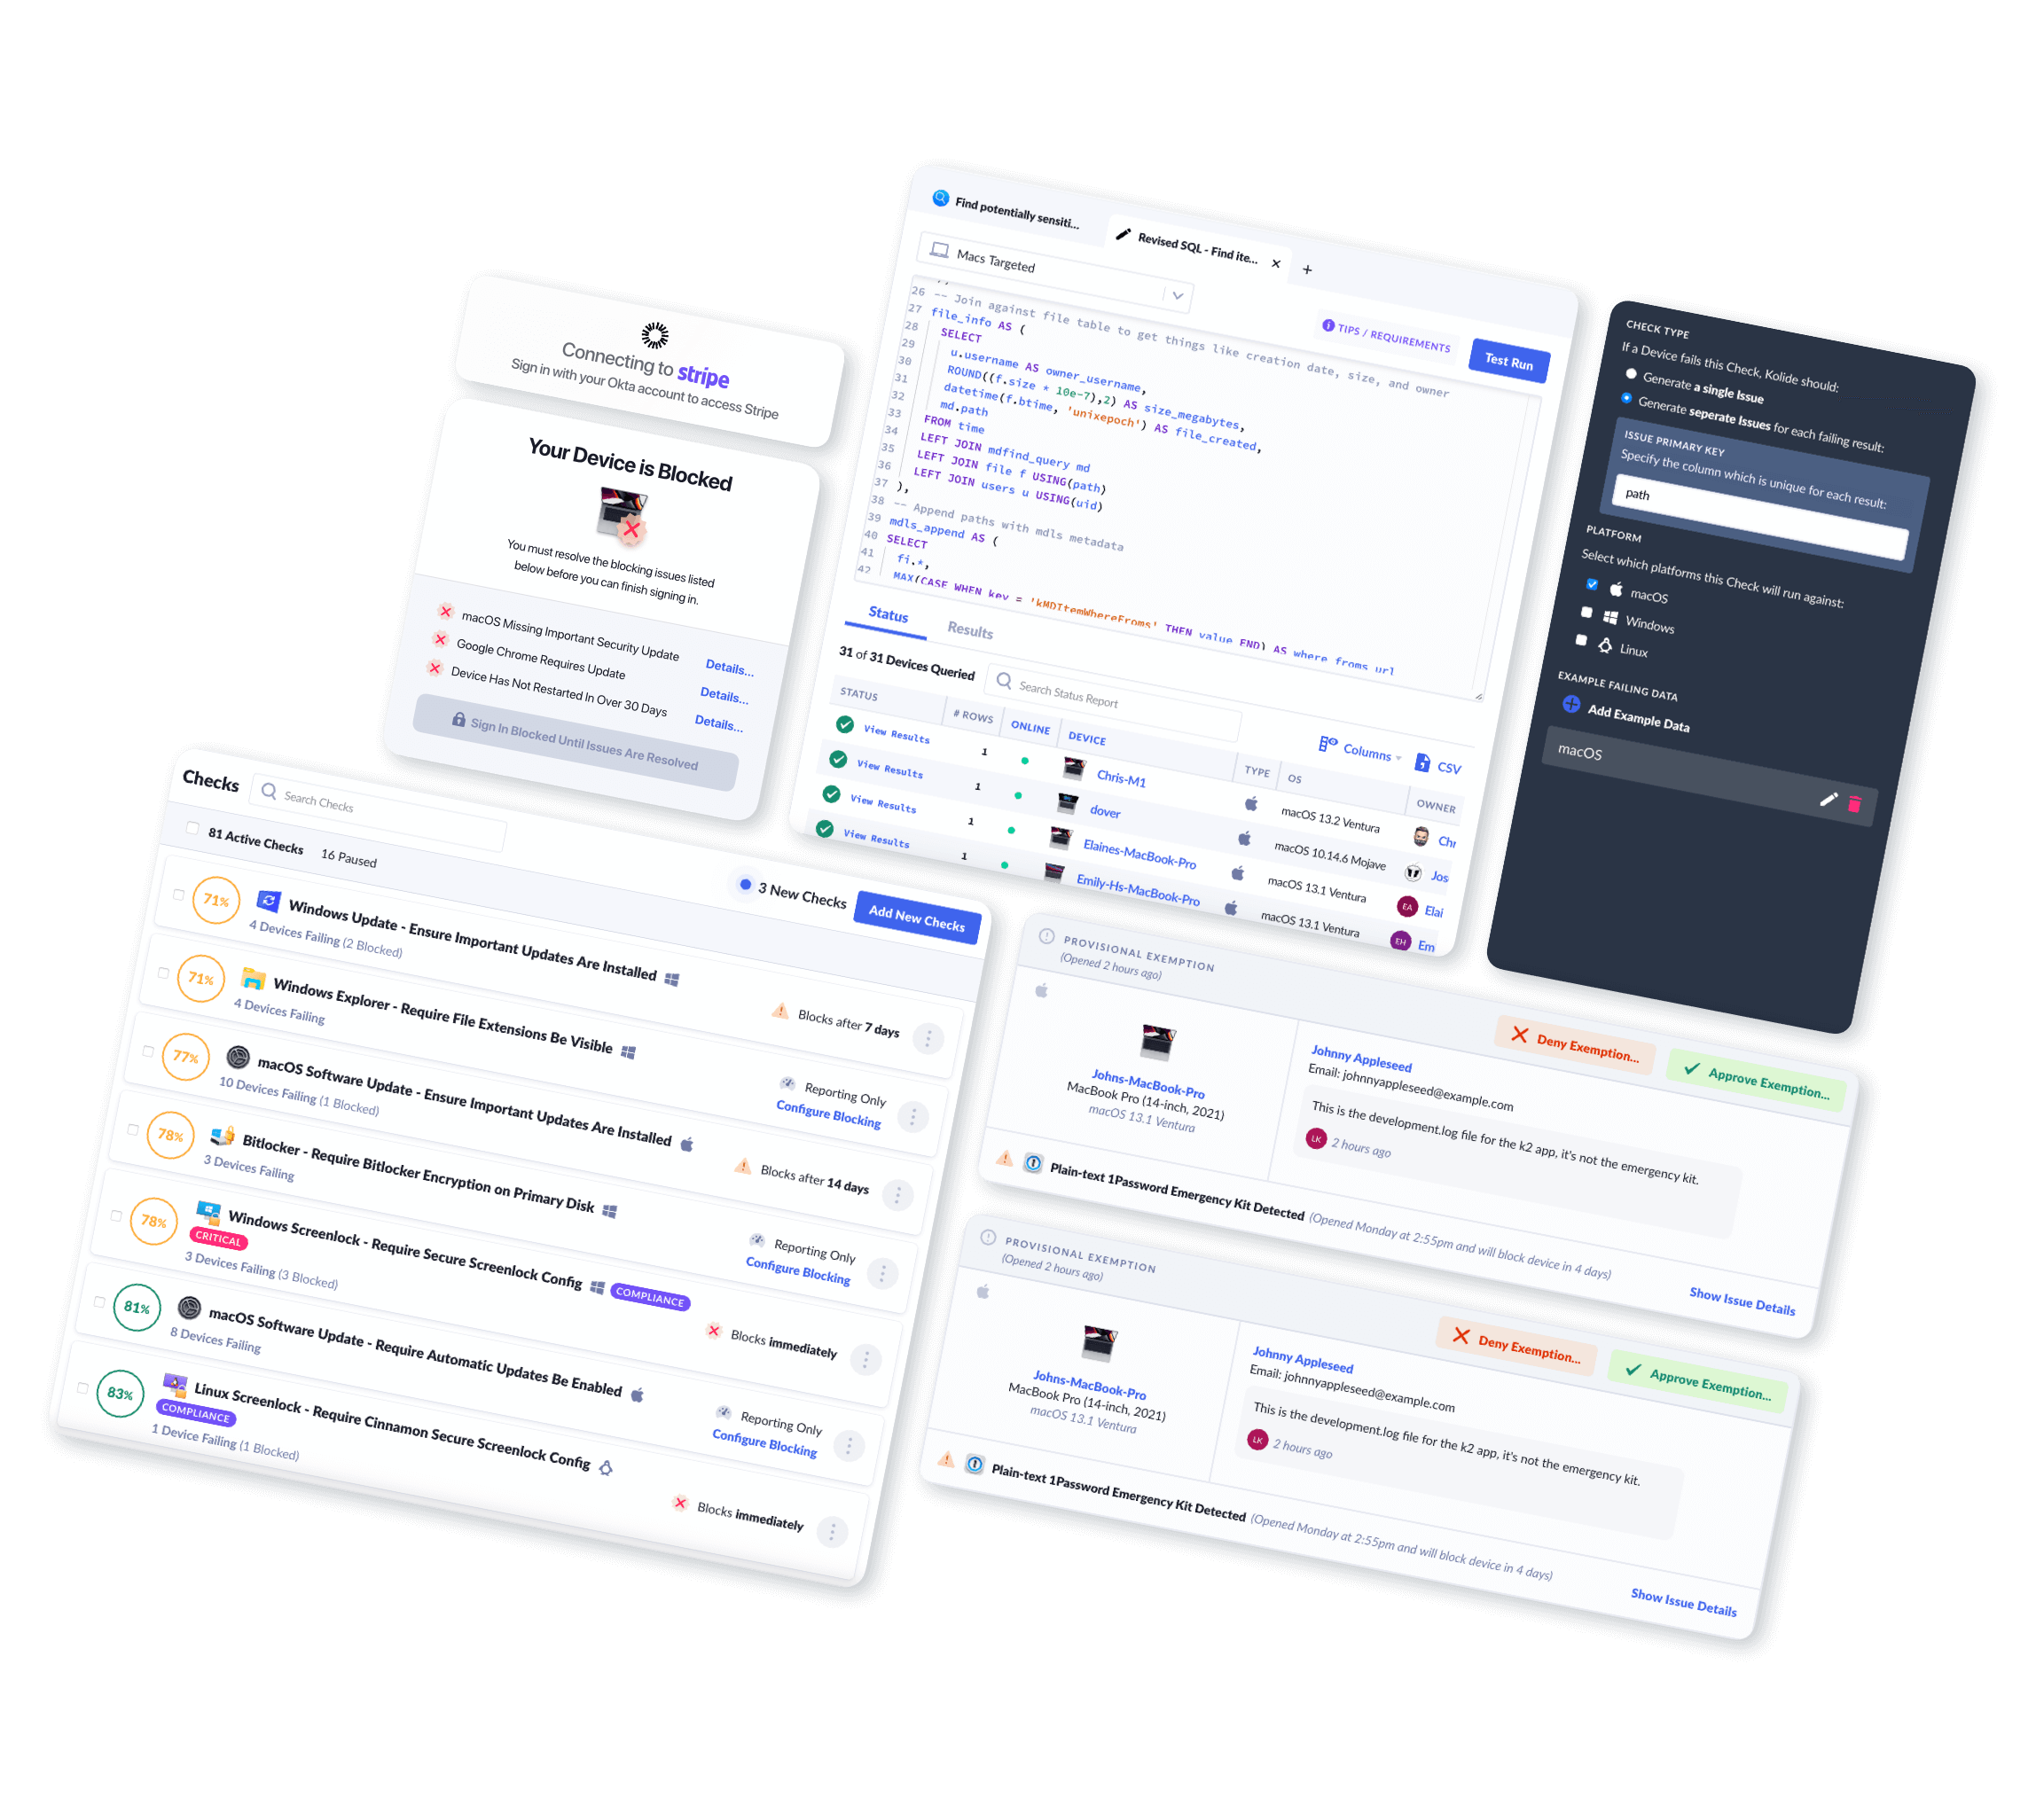
Introducing osquery
![]()
Osquery is a host instrumentation system built with first-class support for macOS. It provides deep introspection capabilities and normalized access to a large number of data sources. Using the SQLite query language, this power is accessible to users from a wide range of technical backgrounds.
Envisioned in 2014 by Facebook’s security team, osquery was created with the following objectives in mind:
First class support for macOS and Linux hosts.
Performant operation for deployment across corporate and production infrastructure.
Capabilities exposed with no need for end users to write additional code.
Thanks to the hard work of the Facebook team — as well as a large community of outside contributors — these goals have largely been achieved.
From its open-source release in 2014, osquery has supported the macOS platform. It builds statically linked binaries that provide easy to deploy capabilities across an entire macOS fleet with no dependencies required. For users with more heterogeneous environments, there is also excellent Linux support, and as of 2016, Windows.
Engineered for performance, osquery is safe to deploy in critical production environments. The project follows a disciplined approach to performance engineering, always directly accessing the system APIs or files containing the relevant information; shelling out is taboo, leading to noticeable performance gains relative to similar tools. A “watchdog” is provided that can enforce resource consumption limits as a safety backstop. This reliability has enabled osquery to be deployed across over a million endpoints in Facebook’s production and corporate infrastructure.
Users are empowered to focus on their information retrieval goals by the standardized query language. Osquery uses SQLite under the covers, enabling all of the productivity and expressiveness of SQL. Users need only to learn this simple SQL dialect, which will already be familiar to many. Operating system concepts mostly wrap neatly to this row-based format, smoothing differences across the formats and APIs that traditionally provide this information.
Installation
It is recommended that readers install osquery and experiment with its capabilities on their own machine.
The supported installation for osquery on macOS is through the package available at osquery.io/downloads. It can also be built from source (available at github.com/osquery/osquery).
The official package includes osqueryd, osqueryi, and a launchd agent that maintains a persistent osquery daemon.
Getting Help
Documentation is available at osquery.readthedocs.io. An active Slack community is available for discussion and support. Sign up at osquery-slack.herokuapp.com.
Exploring Host Internals with osqueryi
Osqueryi is osquery’s interactive shell. It is a great place to get started understanding osquery’s capabilities, testing queries, and performing real time investigation. In addition to user interaction, osqueryi is also a handy tool to generate structured data on demand in a scripting context.
Basic Queries
We can fire up osqueryi and begin to learn the query capabilities of the system. Running the .tables command is a good way to start getting a sense of what is available. More detailed table documentation is also available at osquery.io/docs/tables/. Note the use of .mode line to format query results in an easy to read format (this will be assumed in all further examples).
$ osqueryi
Using a virtual database. Need help, type '.help'
osquery> .mode line
osquery> SELECT * FROM apps LIMIT 1;
name = 1Password.app
path = /Applications/1Password.app
bundle_executable = 1Password
bundle_identifier = com.agilebits.onepassword-osx
bundle_name = 1Password
bundle_short_version = 6.6.4
bundle_version = 664002
bundle_package_type = APPL
environment =
element =
compiler = com.apple.compilers.llvm.clang.1_0
development_region = en
display_name =
info_string =
minimum_system_version = 10.10
category = public.app-category.productivity
applescript_enabled = 0
copyright = Copyright © AgileBits Inc. All rights reserved.
In our query, we selected the first item from the apps table. It is helpful to select only the first item from a table when getting a sense for the information it contains. We can see that osquery abstracted away the search through various standard application paths, and retrieved detailed information about the applications it returned.
Imagine we would like to see if there are any other applications embedded in this bundle. We can harness the power of the SQL engine to do so.
osquery> SELECT bundle_name, path FROM apps WHERE path LIKE '/Applications/1Password.app/%';
bundle_name = 1Password mini
path = /Applications/1Password.app/Contents/Library/LoginItems/2BUA8C4S2C.com.agilebits.onepassword-osx-helper.app
What if we would like to count the Apple applications installed on this machine? We can again take advantage of the SQL capabilities.
osquery> SELECT COUNT(*) FROM apps WHERE bundle_identifier LIKE 'com.apple.%';
COUNT(*) = 271
Some tables provide information about the system hardware states. The fanspeedsensors and temperaturesensors tables access System Management Controller (SMC) data providing structured information without any manual parsing of the SMC data. Arbitrary SMC keys can also be retrieved with the smckeys table.
osquery> SELECT * FROM fan_speed_sensors LIMIT 1;
fan = 0
name = Left side
actual = 2225
min = 2096
max = 5863
target = 2219
osquery> SELECT * FROM temperature_sensors LIMIT 1;
key = TB0T
name = Battery TS_MAX
celsius = 37.4
fahrenheit = 99.3
There is a wealth of information to be found in the tables exposed by osquery; it is left as an exercise to the reader to explore this data and craft further interesting queries.
Digging Deeper
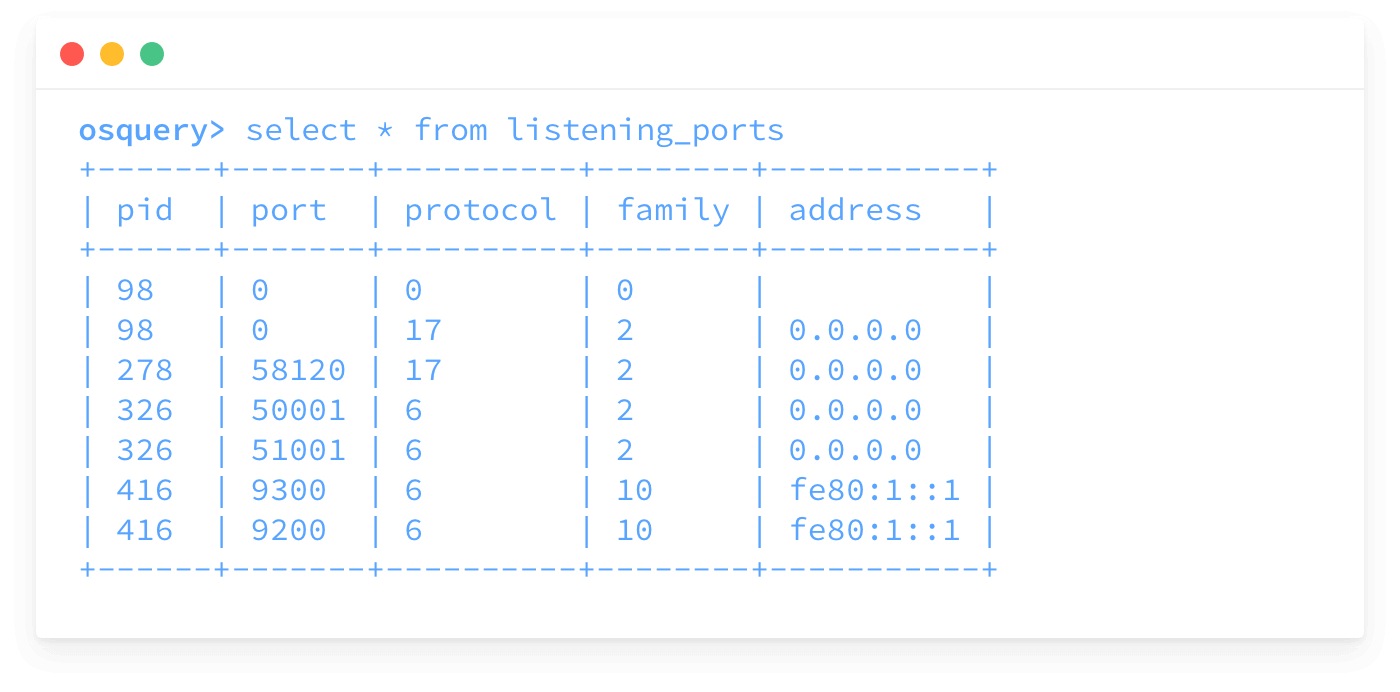
Suppose we are interested in understanding what processes have opened ports for listening on the host. We can join the processes table to the listening_ports table to retrieve this information.
osquery> SELECT name, path, port FROM processes JOIN listening_ports USING (pid) WHERE address = '0.0.0.0';
name = loginwindow
path = /System/Library/CoreServices/loginwindow.app/Contents/MacOS/loginwindow
port = 0
name = SystemUIServer
path = /System/Library/CoreServices/SystemUIServer.app/Contents/MacOS/SystemUIServer
port = 58803
...omitted for brevity...
name = BlueJeans
path = /Users/zwass/Applications/Blue Jeans.app/Contents/MacOS/BlueJeans
port = 18170
Sneaky! It looks like the video-conferencing software we were using last week is actively listening on port 18170. The application isn’t open in the Dock, so where is this coming from? Maybe a launchd agent?
osquery> SELECT name, path, program FROM launchd WHERE program LIKE '%BlueJeans%';
name = com.bluejeans.app.detector.plist
path = /Users/zwass/Library/LaunchAgents/com.bluejeans.app.detector.plist
program = /Users/zwass/Library/Application Support/Blue Jeans/desktop/carmel-detector/startup/start-carmel-detector.sh
We were able to guess at the name and find a launchd agent that looks like it is starting up this process. Investigating the shell script in the program column indicates that this is indeed the case. What is this thing serving up? A quick curl can check if it is HTTP.
$ curl localhost:18170
Blue Jeans App Detector Service
The program definitely seems to be serving up HTTP. This might be a good time to check whether our firewall is turned on, or whether this unknown server might be accessible to other computers on the network. We can do so again with osqueryi.
osquery> select global_state from alf;
global_state = 0
Unfortunately it looks like the firewall is turned off. Now would be a good time to fix up that configuration, and fully remove the video-conferencing software we are no longer using.
Structured Output
It is easy to take advantage of osquery data when scripting. With a variety of data sources provided in a standardized format, this data can be consumed on demand to create powerful programs with little effort. Use the — json flag for JSON output, or the — csv flag for CSV. Note all JSON in this article has been formatted for readability.
$ osqueryi --json 'SELECT * FROM usb_devices WHERE removable'
[
  {
    "model":"Natural® Ergonomic Keyboard 4000",
    "model_id":"00db",
    "removable":"1",
    "serial":"0",
    "usb_address":"14",
    "usb_port":"1",
    "vendor":"Microsoft",
    "vendor_id":"045e"
  }
]
Monitoring and Events with osqueryd
The most common use of osquery is for monitoring and logging changes to the system over time. For this, there is osqueryd, the osquery daemon. osqueryd runs continuously on the host, executing a schedule of queries provided in its configuration. It enables logging of changes to query results over time, and tracking of events that occur between queries.
Differential Queries
The default mode of osqueryd is to log “differential queries”. Using the internal store of osquery, only the changes in results are logged at each run of a query. If there are no changes, no results are logged. This makes the data useful for shipping to a log aggregation system and defining alerts on problematic changes.
What sort of information might be useful to monitor? Let’s consider the example investigation from above. In our exploration with osqueryi, we noticed a few undesirable behaviors. There is no indication that the videoconferencing software was malicious, but the behavior is representative of a common pattern utilized by macOS malware (for example, the recent Dok malware). From an IT compliance perspective, we could log any changes to the firewall state. From a security perspective, additions to the launchd agents could be potential problems. The following is an osqueryd configuration to track each of these concerns:
{
  "schedule":{
    "firewall_state":{
      "query":"SELECT * FROM alf",
      "interval":60,
      "removed":false
    },
    "launchd_agents":{
      "query":"SELECT l.*, h.sha256 FROM launchd l LEFT JOIN hash h ON l.program = h.path",
      "interval":60
    }
  }
}
If we start osqueryd with this configuration (do so with sudo osqueryd — configpath=/path/to/config.json), each of these queries will be executed once per minute and any changes to their results will be logged. We disable logging of removed rows for firewallstate because it generates redundant results in the case of a single row table like alf. This is the log generated when the firewall is disabled:
{
  "name":"firewall_state",
  "hostIdentifier":"zwass.local",
  "calendarTime":"Sun Apr 30 01:15:11 2017 UTC",
  "unixTime":"1493514911",
  "columns":{
    "allow_signed_enabled":"1",
    "firewall_unload":"0",
    "global_state":"0",
    "logging_enabled":"1",
    "logging_option":"0",
    "stealth_enabled":"0",
    "version":"1.5"
  },
  "action":"added"
}
Result logs will go to /var/log/osquery/osqueryd.results.log by default.
Queries can also be scheduled in “snapshot” mode, in which the entire result set is included each time the query is run. A common technique in larger osquery deployments is to schedule a snapshot query to run on a long interval (say, once a week), and the same query in differential mode running hourly or shorter. This optimizes for efficient use of logging pipelines and aggregation tools, and ensures that at most only a week worth of logs would have to be reconstructed to understand the state of a host at any given time.
Capturing Events
Up to this point, the queries we have been executed have been concerned only with the state of the system at the time the query runs. What about events that occur between query runs? The “events” tables in osqueryd solve this problem. Some of the useful event-based tables on macOS are outlined below:
file_events — File Integrity Monitoring (creation/modification/deletion) events on files and directories specified in the osquery config.
hardware_events — PCI/USB (attach/detach) events pulled from IOKit.
disk_events — DMG (load/unload) events.
When these tables are enabled, the event publisher/subscriber system will store events regardless of the frequency of queries. The events will be available for retrieval on the next run of the query. This ensures that reasonable intervals can be used with each query while assuring users that important events will not be missed.
The following is an example configuration for monitoring hardware events:
{
  "schedule":{
    "hardware_events":{
      "query":"select * from hardware_events",
      "interval":10
    }
  }
}
Using this configuration, logs generated when adding a USB device look like this:
{
  "name":"hardware_events",
  "hostIdentifier":"zwass.local",
  "calendarTime":"Tue May  2 16:53:01 2017 UTC",
  "unixTime":"1493743981",
  "columns":{
    "action":"attach",
    "driver":"IOUSBDeviceUserClientV2",
    "model":"",
    "model_id":"00db",
    "path":"19:1",
    "revision":"",
    "serial":"0",
    "time":"1493743978",
    "type":"IOUSBDevice",
    "vendor":"Microsoft",
    "vendor_id":"045e"
  },
  "action":"added"
}
There is also an experimental kernel extension for macOS that enables a process_events table recording events about all process executions.
Query Packs
In working with osquery, it is common to find sets of queries with a shared purpose. Perhaps queries that should be run on macOS hosts for security, or webservers for devops. Users are encouraged to tease out these patterns and create topical “query packs” that organize groups of queries.
Query packs provide an explicit means for scheduling, targeting and sharing these sets of queries. The osqueryd scheduler can automatically load packs from JSON placed in the correct directory, as though they are explicitly scheduled queries. These packs can be targeted to hosts with specific properties using “discovery queries” — If the associated discovery query returns a non-empty result set, the queries in the pack will be scheduled. As standalone JSON files, packs are easy to share internally within companies, and with the community. The osquery project maintains a set of community supported packs (for example, a pack looking for indicators of common macOS malware).
Imagine we want to apply extra scrutiny to any macOS hosts that have their application layer firewall turned off. We could do this with a query pack containing a discovery query that matches only when the firewall state is off (In this example, we include the pack directly in the osquery configuration file for simplicity).
{
  "packs":{
    "macos_firewall_disabled":{
      "discovery":[
        "select * from alf where global_status = 0"
      ],
      "queries":{
        "process_listening_ports":{
          "query":"SELECT * FROM processes JOIN listening_ports USING (pid)",
          "interval":60,
          "description":"All processes with open ports"
        }
      }
    }
  }
}
Integrating osqueryd with Plugins
In order to support varying environments and workflows, many of the osqueryd components utilize a plugin-based architecture. The components with supported plugins are:
Configuration plugins — Pull osquery configurations, query schedules, etc. from various sources. Defaults to reading from the filesystem. Can be configured to communicate with an HTTP server over TLS to retrieve configuration.
Logger plugins — Output status logs and query results for external consumption. Defaults to writing to the filesystem. Can be configured to POST over HTTP, write to a syslog daemon, or Amazon Kinesis or Firehose streams.
Distributed plugins — Connect to a remote server to retrieve queries to run on demand. Only implemented for interaction with an HTTP server. Using the distributed plugin requires a management server such as Kolide.
Plugins can be mix-and-matched, so an osquery installation could read configuration from the local filesystem, write logs to syslog, and communicate with an HTTP server for live queries. A common configuration is to write logs to the filesystem, and then use a tool like Logstash to forward logs to the ELK stack for archiving and analysis.
Conclusion
This article has walked through the basic concepts and data sources available in osquery. The basic workflow of osquery usage has been exposed: Begin with investigation and ad-hoc understanding in osqueryi. When the data is better understood, implement consistent monitoring (and possibly alerting) using the scheduled differential query and eventing system in osqueryd. Users are encouraged to explore the available tables and experiment with writing queries, and logging data for useful analysis. The osquery tools are highly composable and extensible, enabling rich analysis without writing new code.
If you’d like to read more osquery content like this, sign up for our biweekly newsletter.